Matplotlib
Matplotlib是一个作图库。这里简要介绍matplotlib.pyplot模块,功能和MATLAB的作图功能类似。
Plotting(绘图)
matplotlib库中最重要的函数是Plot。该函数允许你做出2D图形,如下:
import numpy as np
import matplotlib.pyplot as plt

# Compute the x and y coordinates for points on a sine curve
# 计算正弦曲线上的点的x和y坐标
x = np.arange(0, 3 * np.pi, 0.1)
y = np.sin(x)

# Plot the points using matplotlib
# 使用matplotlib绘制点
plt.plot(x, y)
plt.show()  # You must call plt.show() to make graphics appear.
# 必须调用plt.show()才能显示图形。
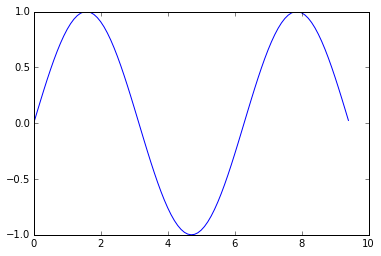
运行上面代码会产生下面的作图:
只需一点额外工作,我们就可以轻松地一次绘制多条线,并添加标题,图例和轴标签:
import numpy as np
import matplotlib.pyplot as plt

# Compute the x and y coordinates for points on sine and cosine curves
x = np.arange(0, 3 * np.pi, 0.1)
y_sin = np.sin(x)
y_cos = np.cos(x)

# Plot the points using matplotlib
plt.plot(x, y_sin)
plt.plot(x, y_cos)
plt.xlabel('x axis label')#添加坐标轴标签
plt.ylabel('y axis label')
plt.title('Sine and Cosine')# 添加标题
plt.legend(['Sine', 'Cosine'])# 添加图例
plt.show()
关于 plot 函数的更多用法 documentation.
绘制多个图像(Subplots)
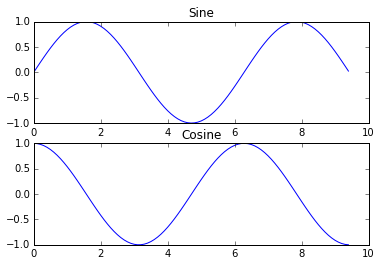
可以使用subplot函数来在一幅图中画不同的东西:
# 导包
import numpy as np
import matplotlib.pyplot as plt

# Compute the x and y coordinates for points on sine and cosine curves
x = np.arange(0, 3 * np.pi, 0.1)
y_sin = np.sin(x)
y_cos = np.cos(x)

# Set up a subplot grid that has height 2 and width 1,
# and set the first such subplot as active.
# 设置图形输出窗口高2个,宽1个,设置第一个窗口激活
plt.subplot(2, 1, 1)

# Make the first plot(绘制第一个窗口)
plt.plot(x, y_sin)
plt.title('Sine')

# Set the second subplot as active, and make the second plot.
# 激活第二个窗口,绘制
plt.subplot(2, 1, 2)
plt.plot(x, y_cos)
plt.title('Cosine')

# Show the figure.
# 图形输出
plt.show()
关于subplot的更多细节,可以阅读documentation.
图像(images)
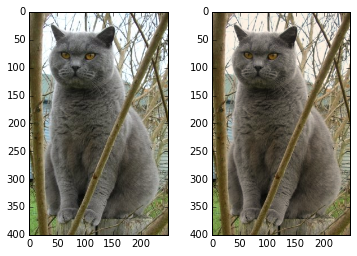
你可以使用imshow函数来显示图像,如下所示:
# 导包
import numpy as np
from scipy.misc import imread, imresize
import matplotlib.pyplot as plt

# 读取图片并设置图片颜色通道属性
img = imread('assets/cat.jpg')
img_tinted = img * [1, 0.95, 0.9]

# Show the original image
# 在左边输出原图
plt.subplot(1, 2, 1)
plt.imshow(img)

# Show the tinted image
# 在右边输出着色修改的图片
plt.subplot(1, 2, 2)

# A slight gotcha with imshow is that it might give strange results
# if presented with data that is not uint8. To work around this, we
# explicitly cast the image to uint8 before displaying it.
# 与imshow的轻微关系是它可能会给出奇怪的结果 。如果出现的数据不是uint8。为了解决这个问题,我们在显示之前强制地将图像转换为uint8
plt.imshow(np.uint8(img_tinted))
plt.show()